Infographic: How Does the Average Canadian Spend their Paycheque?
Pretty well, actually. According to the data, most provinces are overspending their paycheques.
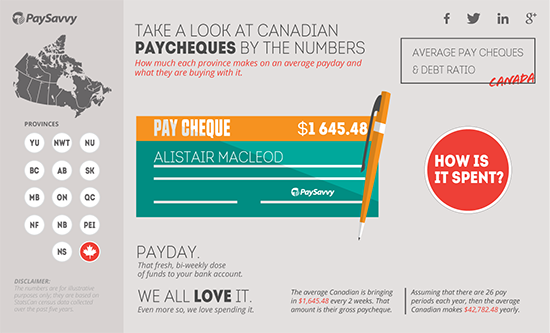
In honour of the Canadian Payroll Association’s celebration of National Payroll Week 2014, we crunched the numbers. By looking at StatsCan data for each province, we calculated the average paycheque individuals are bringing home every 2 weeks (26 pay periods a year), and how that money is spent in each province.
Check out the interactive infographic where you can explore each province’s statistics and see exactly how their paycheques are spent. Compare your province to the rest of Canada and see how your spending stacks up against the average.
Oh, and residents of Northwest Territories – get ready for a whole lot more neighbours. We just have to buy our parkas first.
Some Interesting Facts about Canadians & Their Paycheques:
- Any Vancouver resident could have told you that British Columbians spend the highest proportion of their paycheque on their shelter.
- The largest average paycheque in Canada goes to the Northwest Territories.
- The smallest average paycheque in Canada goes to residents of Prince Edward Island.
- Despite that, PEI residents appear to spend less than they earn.
- Unfortunately, for most of Canada that is not true, Canadians appear to be accumulating about $65.11 of debt each paycheque.
- This amounts to $1692.86 extra debt per year.
- Not far from StatsCans’ report that Canadians’ debt increased by $2779 from 2012 to 2013.
View the full infographic.
This post originally appeared on the PaySavvy Blog