HR Metrics Tell a Timely Tale
By Ian J. Cook, CHRP and Helen Luketic, CHRP
Time is the crucial ingredient for transforming numbers into meaningful narrative. Case in point, the chart of the TSX from August 2008 up to the moment tells an interesting tale that moves from boom to bust to recovery to our present uncertainty.
The real value from a set of data comes from the narrative that emerges. Consistently monitoring the same items over time turns snapshots into stories, providing a way to spot patterns and changes while providing a context for further comparison and extrapolation.
After five quarters of collecting data, the HR Metrics Service run by BC HRMA is now equipped to share a number of timely stories of interest and value to HR and business leaders alike.
Setting the Stage
The HR Metrics Service came into full operation in Q1 of 2009. This proved to be the lowest spot of the recessionary cycle. Since then, we have collected data from organizations every quarter pertaining to revenue and operating costs, as well as labour costs, staff vacancies, HR costs and many more. This information is then used to calculate standardized metrics as found in the HR Metrics Standards & Glossary.
The following analysis uses data from the five quarters starting January 1, 2009 to March 31st 2010. Naturally, the context is as important as the content and the prevailing economic climes play a large role in shaping the stories that have emerged.
What is happening to retirement?
An important story for HR right now is the pattern of retirements. Many organizations are facing a significant number of retirements over the coming five to 10 years and gap planning is a priority. Nonetheless, commentary in the press and from consulting firm surveys has suggested that people are delaying their retirements due to the money lost during the stock market bust.
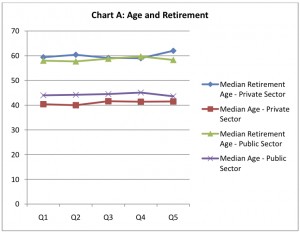 Interestingly, the data collected by the HR Metrics Service suggests that this argument is not true in all circumstances. Over the past year, we have seen no change to the actual retirement age of the people in our sample group. Chart A shows how the actual median retirement age in both the public and private sectors has been similar for the last five quarters. This line would have trended upwards if whole population of workers was actually delaying retirement.
The fact that people are not delaying retirement means that organizations need to keep moving to close the gap being created by these retirements. The difference between the common view expressed in the media and the actual data presented suggest that it is important to understand actual retirement patterns for your organization and not to follow common perceptions when making workforce planning decisions. The key to getting this right is to know your own data and your own story. This allows you to relate to the benchmark and then respond in a way that works for your business. For example 60 is the current median retirement age in the private sector, if your median retirement age is earlier then you know you will have to put more urgency behind filling your gap.
 Where there is a significant difference in retirement volumes between workers in the public and private sector as show in Chart B. The fact that the public sector has employees with defined benefits pension plans and longer job tenure contributes1 to the higher rate of retirement at a younger age. This makes the challenge faced by the public sector tougher than that faced by the private sector.
A recent report by the Conference Board of Canada2 noted that although the median percentage of people eligible to retire is 6%, the median expected retirement rate is 1%. These projections assume that only 16% of those eligible to retire actually will.
If these projections are wrong and we see more retirements than planned, then organizations will very quickly be left without the experienced talent they need to succeed. The story from our data is that retirements are not being delayed en masse and organizations should make sure they clearly understand the intentions of their eligible staff, or risk being unable to achieve their organizational goals through a lack of sufficient talent.
What is happening to staffing?
Significant change has characterized the past year. The general pattern for private sector organizations shows up across a range of the data. We experienced a very slow first quarter with limited hiring, limited staff movement and limited turnover. Staff movement in the second and third quarters was significantly higher.
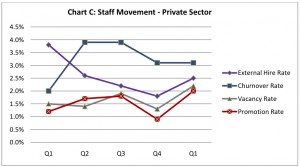 Staff movement is tracked through a metric called the Churnover Rate; this metric shows the percentage of all staff who moved within the organization whether up, down or sideways. Between Q1 and Q2, the Churnover Rate doubled from 2% to 4% and stayed there for Q3 before settling back down to 3% for the next 2 quarters. The dark blue line in Chart C shows the variation in the Churnover Rate for the last five quarters.
While we witnessed increases in internal movement, at the same time, we saw a drop in external hiring as shown by the purple line in the Chart C. Given that most organizations were shrinking their overall headcount this makes sense. The internal movement was generated by the creation of re-organized departments and roles; rather than filling these from outside the organization they were filled by candidates from within.
The beginning of 2010 has seen a return of confidence within the private sector and this has coincided with an increase in external hiring and an increase in the Vacancy Rate. Between Q4 of 2009 and Q1 of 2010, the Vacancy Rate increased by over 30% and is now at the highest it has been for the last five quarters.
The increase in the promotion rate in Q1 of 2010 is an indicator of increased optimism and suggests that we will see increased private sector hiring and the steady rebuilding of staffing levels as organizations re-adjust to a more positive economic picture. As people are promoted, it creates roles that need to be filled; the increased Vacancy Rate and external hiring rate indicate that organizations are now looking to the external labour market to fill these posts. The data pointing to projected increases in staffing levels is corroborated by the results of BC HRMA’s HR Trends survey for 2010.
We saw significant variation across the recruitment metrics of External Time-to-Fill and External Offer Acceptance Rate. The median External Time-to-Fill peaked at 35 days in Q3 before settling back to 22 days in Q4. This change was mirrored by the Vacancy Rate – the more vacancies, the longer the time to fill.
More vacancies and longer times-to-fill were linked to lower External Offer Acceptance Rates, suggesting that job hunters are well aware of their choices. It will be important for organizations to monitor their Vacancy Rate and adjust their expectations on External Time to Hire and likelihood of landing their first choice candidate as we rebuild staffing levels in 2010.
While the pattern described relates to the private sector, from our analysis of the HR Trends survey for 2010, our projection is that the public sector will be following the same pattern during 2010 and into 2011.
The Impact of Absenteeism
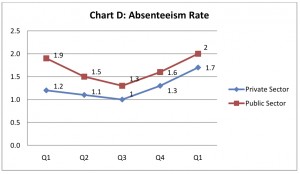 One of the areas that is significant in terms of HR impact is the area of absenteeism. The data shown in Chart D reflects the number of days absent per FTE for each quarter, as well as showing how the Absenteeism Rate differs both quarter to quarter and between the public and private sectors.
For the private sector, the median number of days in 2009 lost to absenteeism per FTE is 4.6 and in the public sector 6.3 days. Both sectors show an increase in absenteeism for Q1 of 2010. Overall absenteeism in BC was lower than the Canadian average recorded by the Conference Board of Canada as 5.6 days for the private sector and 8.1 days for the public sector.
As the pressures of lean staffing, organizational change and increased contribution build over the coming years, monitoring changes in Absenteeism Rate will be an important overall indicator of organizational effectiveness and sustained performance.
The next chapter
2010 is showing signs of slow and steady growth. Organizational budgets are growing and so are employment numbers. However, the challenges remain. Emerging from a period of recessionary reaction, we are hearing media reporting that employee engagement has declined and warning that given the opportunity, employees will leave their current organization.
As business decisions become more complex, more ambiguous and subject to more external volatility, success depends on a steady flow of accurate data to ensure that not only is the right decision made but that progress against that decision is monitored.
Are you prepared to meet your hiring goals in a tougher recruitment market? Are you spending more on absenteeism than your competitors? Have you rested on your laurels expecting delayed retirements to maintain your staffing levels? The stories above provide you with answers to these questions. More importantly they provide you the information you need to continue writing the organizational story that you want.
This article was co-authored by BC HRMA’s director of research and learning Ian J. Cook, CHRP and Helen Luketic, CHRP.
(PeopleTalk: Fall 2010)


